[scRNA-seq] Barnyard (multi-species) scRNA-seq with 10X Chromium: classifying species-specific barcode reads
I am currently conducting research with patient-derived xenograft (PDX). (host = mouse, graft = human)
When analyzing barnyard (multi-species) scRNA-seq data through a 10X Chromium pipeline, rather than using cytometry-based cell sorting or laser microdissection, you have to pay attentian to host/graft/multiplet distinction.
In this post, I’m going to propose a pipeline classifying species-specific barcode reads, and compare with the canonical pipeline with cellranger count.
1. Canonical pipeline with CellRanger
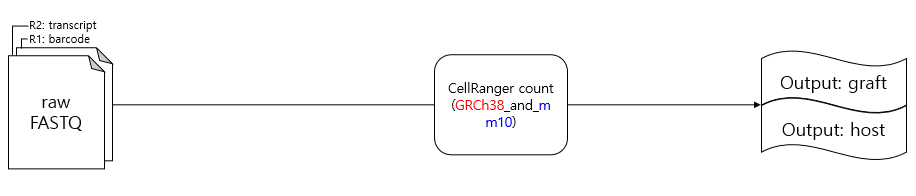 Fig: Summary of the canonical pipeline.
While using the 10X pipeline with cellranger, you typically go through cellranger mkfastq followed by cellranger count. During the cellranger count process, a reference genome is required for alignment. For mouse+human multi-species experiments, you can use the GRCh38_and_mm10 reference genome provided by 10X Genomics. If not, you can create your own reference genome.
$ cellranger mkref \
> --genome=GRCh38 \
> --fasta=GRCh38.fa \
> --genes=GRCh38-filtered-ensembl.gtf \
> --genome=mm10  \
> --fasta=mm10.fa \
> --genes=mm10-filtered-ensembl.gtf
Then, run cellranger count with the reference genome containing the multi-species genome information.
$ cellranger count --id=sample345 \
                   --transcriptome=/opt/refdata-gex-GRCh38-and-mm10-2020-A \
                   --fastqs=/home/jdoe/runs/HAWT7ADXX/outs/fastq_path \
                   --sample=mysample \
                   --localcores=8 \
                   --localmem=64
And the mapping results look like this:
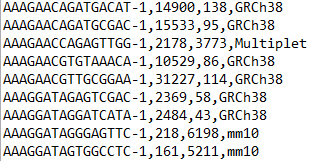
From left to right: barcode, count mapped to GRCh38, count mapped to mm10, and the call.
(This classification result is located in ./10X_result/outs/analysis/gem_classification.csv)
The problem with this method is that I am not satisfied with the algorithm that maps multi-species cell barcodes to each species.
The algorithm used by cellranger count to distinguish multi-species is as follows:
-
Take the 10th percentile of all barcodes where (mouse>human UMI counts). That becomes the threshold for calling a barcode a mouse cell.
-
Take the 10th percentile of all barcodes where (human>mouse UMI counts). That becomes the threshold for calling a barcode a human cell.
-
Any barcode where both mouse and human counts exceed their thresholds is classified as a multiplet.
(source: 10X Genomics)
In other words, it does not accurately distinguish human/mouse/multiplet cells mathematically or algorithmically, but rather cuts off at the 10th percentile (top 90%) for identification. Crucially, the documentation states:
Typically this is done with a 50:50 mixture of mouse and human cells. The further away from a 50:50 mixture, the less accurate the barcode classification is.
The classification is most accurate when the ratio of human to mouse cells is 50:50, and becomes more inaccurate as it deviates from this ratio.
Because of these issues, I had to create something out of nothing.
2. Proposed Pipeline
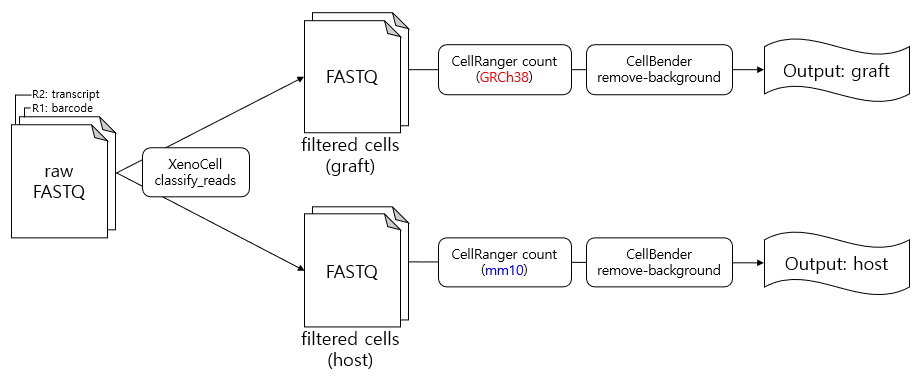
My pipeline looks like this:
2.1. XenoCell classify_reads
XenoCell is a tool that adapts Xenome, commonly used in xenograft RNA-seq analysis, for use in scRNA-seq.
Before running it, you need to generate a Xenome index:
singularity exec \
--bind /data:/data \
/data/xenocell/container/xenocell_1.0.simg \
xenocell.py generate_index \
--host /data/PGP/reference_genomes/refdata-gex-mm10-2020-A/fasta/genome.fa \
--graft /data/PGP/reference_genomes/refdata-gex-GRCh38-2020-A/fasta/genome.fa \
--output /data/PGP/reference_genomes/xenome/graft_GRCh38_host_mm10 \
--threads 16 \
--memory 60
For --host and --graft, if you downloaded the reference genome from 10X CellRanger, there is a genome.fa file inside that folder. Use that.
Next, perform classify_reads
singularity exec \
--bind /data:/data \
/data/xenocell/container/xenocell_1.0.sif \
xenocell.py classify_reads \
--transcript $FILE_PATH/sample_id_L001_R2_001.fastq.gz \
--barcode $FILE_PATH/sample_id_L001_R2_001.fastq.gz \
--barcode_start 1 \
--barcode_length 12 \
--index /data/PGP/reference_genomes/xenome/graft_GRCh38_host_mm10 \
--output /scratch/PGP/xenocell/test_runs/2020-12-01/P3 \
--threads 16 \
--memory 60 \
--compression_level 1
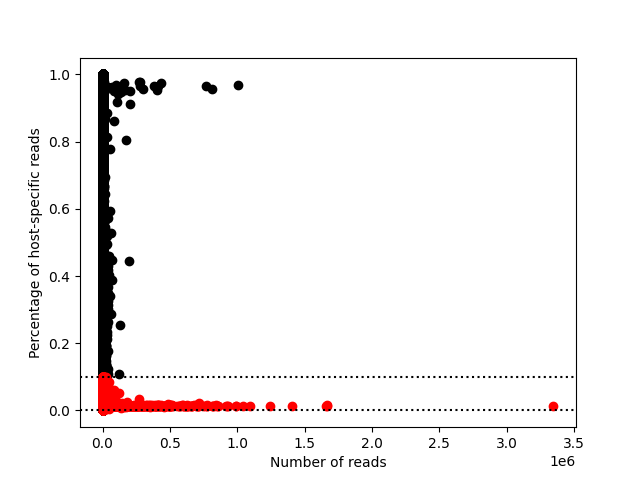
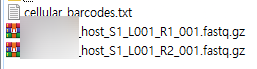
After classify_reads, extract the host-specific and graft-specific cellular barcodes separately. This will output R1 (barcode) and R2 (transcript) fastq files for host-specific and graft-specific reads, which can then be input into cellranger count with the reference genome for each species.
Refer to this link for details.
 |
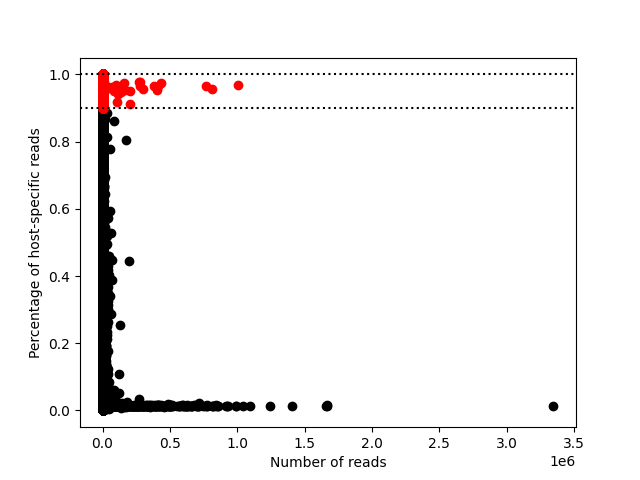 |
Typically, a host-specific reads ratio of 0-0.1 is considered graft, and 0.9-1 is considered host. The above is an example graph.
2.2. CellRanger count
The reads classified as graft are input into cellranger count with the GRCh38 reference genome, while the reads classified as host are input with the mm10 reference genome. Note that the output file names from XenoCell may not be compatible with CellRanger, so refer to the CellRanger documentation and rename the files accordingly (files containing transcripts as R2, files containing barcodes as R1).
At this point, you have gene count matrices for each species, so you can happily proceed with analysis using Seurat, Scanpy, or other tools. However, for quality enhancement, I added one more step.
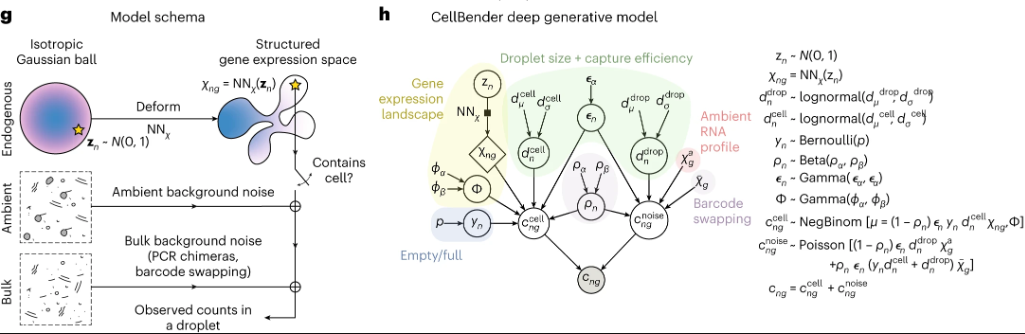
2.3. CellBender
CellBender is a recent pipeline published in Nature Methods by the Broad Institute at Aug 2023. It uses a deep generative model to reduce background noise.
Installation and Usage is very simple: refer to the official documentation
$ pip install cellbender
(cellbender) $ cellbender remove-background \
                 --cuda \
                 --input raw_feature_bc_matrix.h5 \
                 --output output.h5
I applied this to both graft and host data.
After the whole process, I simply removed multiplets using scDblFinder during the preprocessing step in Seurat.
Through this process, I succeess in significantly improving my data quality.
Leave a comment